palerider
Well-Known Member
- Joined
- Feb 26, 2007
- Messages
- 4,624
Atmospheric temperature is only one measure of the heat absorption. Before 1990 the sea level was rising at 1.9 mm/yr. and in the last 16 years it's rising at an increased rate of 3.2 mm/yr.
Even when you are given evidence that your claim is a lie and is nothing more than the result of cooked books, you continue to make it. Here, have another look at what climate pseudoscience has done with sea level.
Luckily, old data is still hanging around to be found to bring the fraud of the climate science modern climate science community into high relief. This is the sea level increase between 1880 and 1980 shown by NASA. The graph shows an increase of just over 3 inches of sea level increase between 1880 and 1980....NOTE the sharp decrease in the rate of increase after 1950.
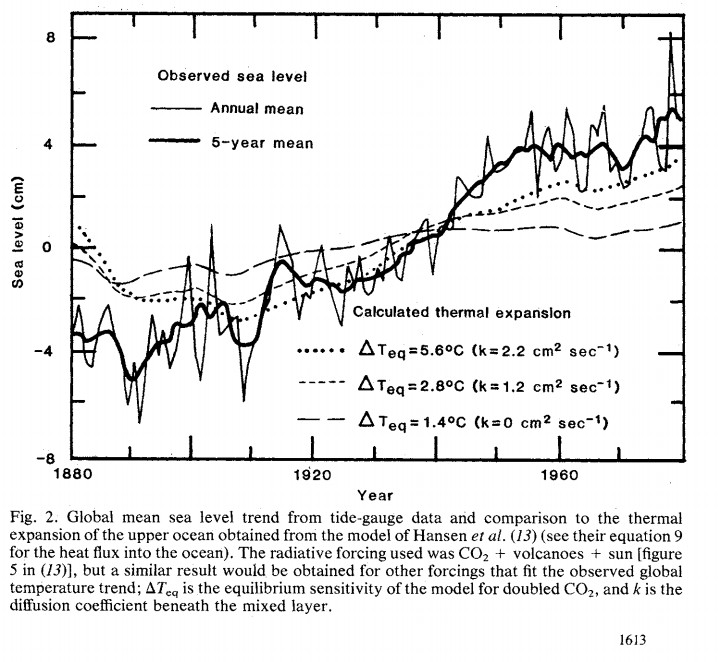
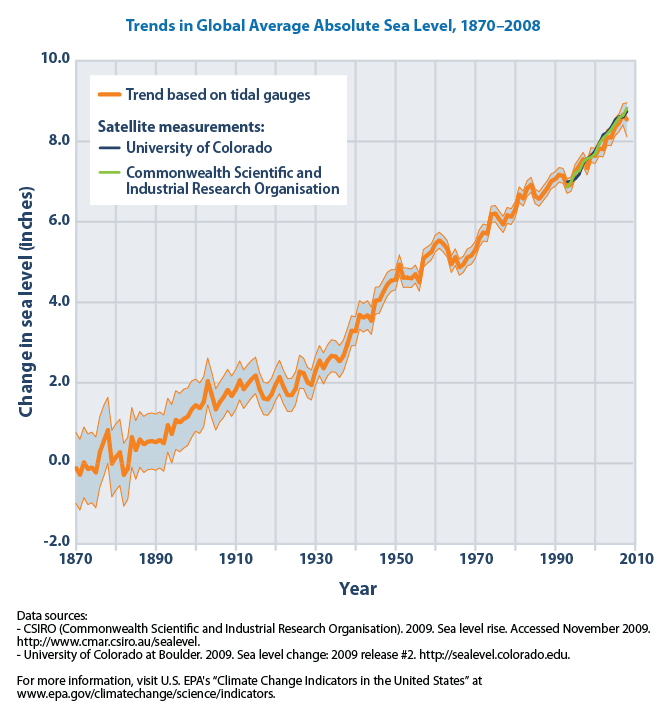
You can't really scare people with a 3 inch sea level increase over a 100 year period so the frauds in climate science increased the figure to 6 inches per century with nothing more than adjustments.... NOTE the completely FAKE acceleration after 1950.
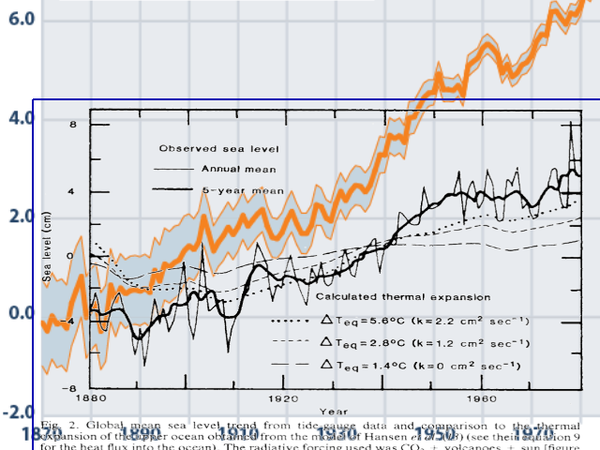
Here is an overlay of the two graphs on the same time scale. One is scientific in nature...showing actual observed sea level increases...the other is a piece of alarmist propaganda that has nothing whatsoever to do with science and everything to do with supporting a fraudulent narrative.
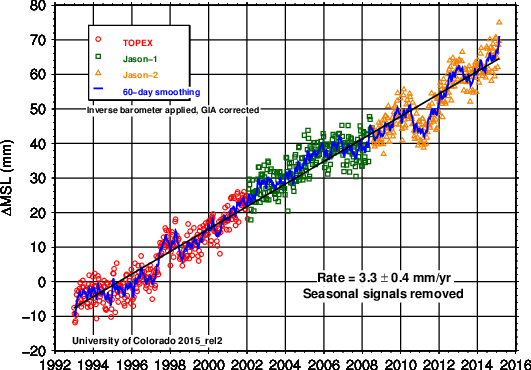
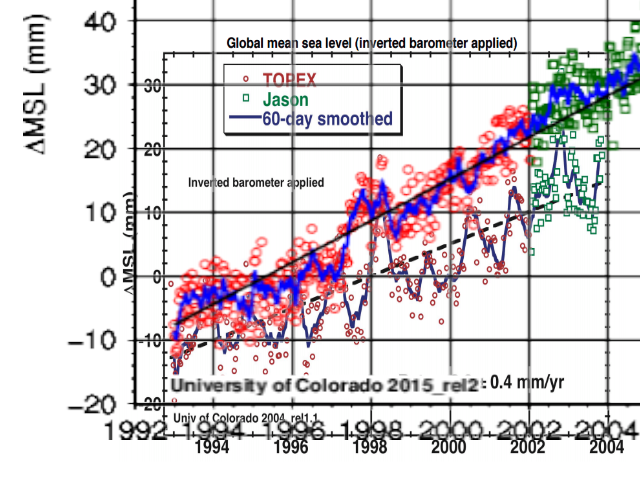
Then in 2004, the University of Colorado showed 2.8 mm per year rate of sea level increase.
2.8 mm per year? Not very scary...even to alarmists so again, the data is heavily massaged using inappropriate, and completely fraudulent methods to achieve a 3.3mm per year rate of increase. A global isostatic adjustment was applied which is blatantly fraudulent in the context of sea level increase. Such adjustments are correct in the context of calculating ocean depth as the sea floor sinks and have absolutely no relationship to measuring sea level by satellites. Here is what the adjustments look like...Graph look familiar lagboltz? You presented as "credible" on another thread. What a laugh.
Here is an overlay of the two graphs at the same time scale.
So some numbers got a massage and a picture was painted to give the appearance of imminent disaster. Shit happens...right? But when the "spokes agency" for modern climate science repeats the fraud as truth....we have real evidence of deliberate data corruption with the intent to deceive regarding climate change. In 1990 the IPCC said:
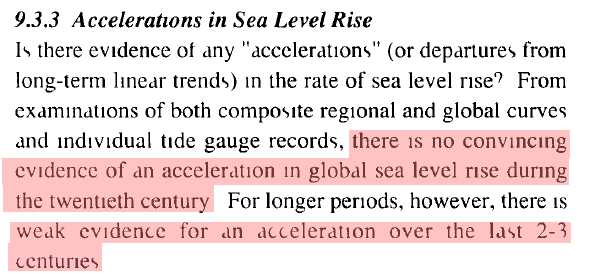
Then in 2013 using blatantly massaged data and obviously fraudulent graphs, the IPCC said exactly the opposite of what they said in 1990.
It takes 320 times more calories to melt a gram of ice than it does to heat a gram of air by one degree C. So water level is a very important indicator that energy absorption of earth increased over the last 16 years even though the atmospheric temperature has not.
So since the rate of sea level rise is actually decreasing as opposed to the increase claimed by climate pseudoscience, I guess we have nothing to worry about and the oceans didn't actually eat any warming..
Anyone who believes anything coming out of the climate science community today is a f'ing gullible idiot.
By the way...do you know what the opposite of skeptical is?....answer....... gullible.